To find bottlenecks in an Express app during k6 load testing, use express-k6-profiler.
k6 showed me my backend latency was high.
But not why.
This shows exactly where time is spent inside your Express app.
It breaks down request time into middleware, route handlers, and database calls.
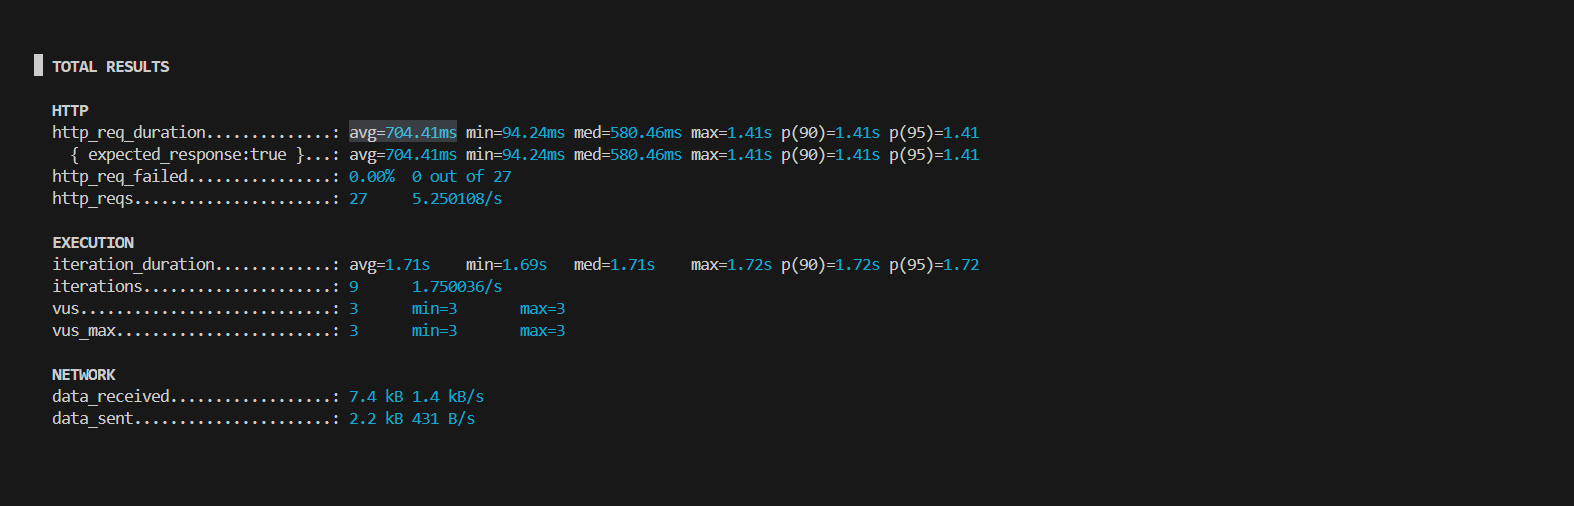 shows
shows avg=704.1ms but where is that time going?
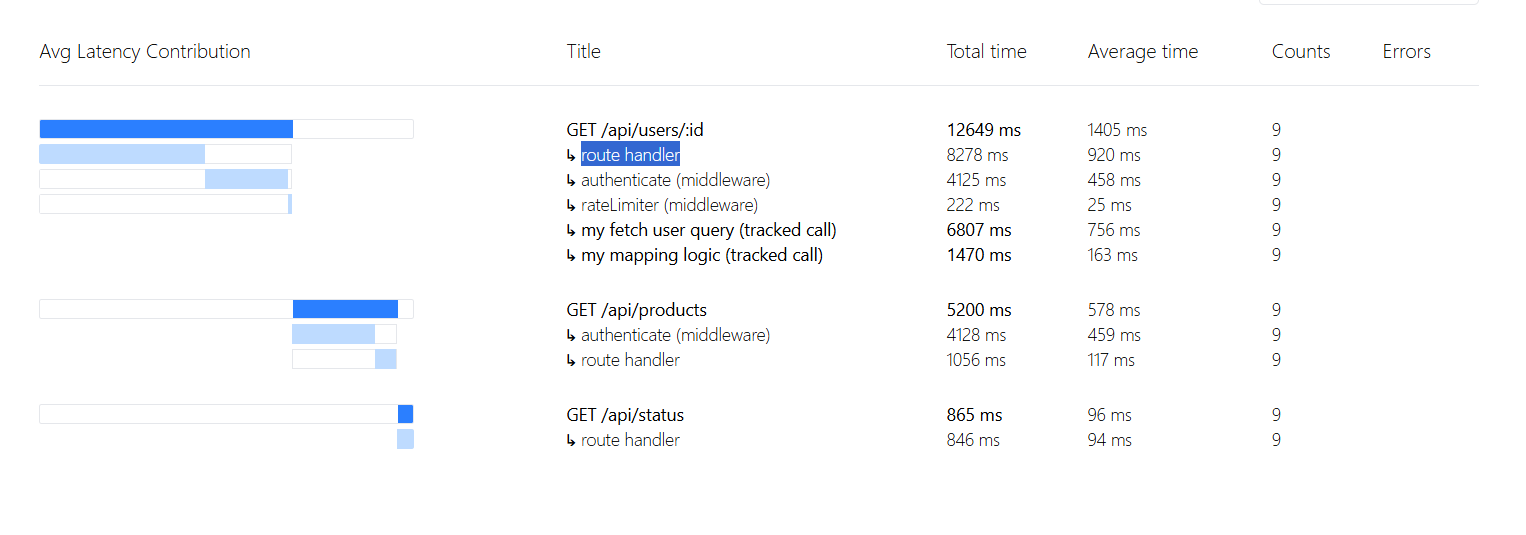 ...reveals
 GET /api/users/:id as the bottleneck
Common use case: k6 shows high latency, but you need to find the exact bottleneck inside your Express app.
Use this if:
- k6 testing shows high latency but you don’t know why
- you want to see time spent in middleware vs handlers vs DB queries
- you don’t want full tracing setup (Jaeger, OpenTelemetry, etc.)
npm install express-k6-profilerconst { profile } = require('express-k6-profiler');
const app = express();
profile(app);//<- enable profilingRun k6 test, then open your-backend.com/__profile
If your app is mounted under a prefix (e.g. /api) or you're using Kubernetes/ingress routing, you can change where the profiler is exposed:
profile(app, { prefix: '/your/secret/path' });Then open your-backend.com/your/secret/path/__profile
You can track specific operations like database calls:
const { track } = require('express-k6-profiler');

app.get('/api/users/:id', async (req, res) => {
  const user = await track('my get user query',
    () => User.findById(req.params.id)
  );

  await track('my mapping logic',
    () => {/* a 50ms blocking work here*/}
  );

  res.json({ user });
});k6 tells you how slow an app is. But does not tell you:
- which middleware is slow
- which route is the problem
- if the database is the bottleneck
- Adds a small overhead
- Use in staging/testing (not production)
Feedback and issues are highly welcome!