polist is a Python package that provides a set of utilities for working with List-type columns in Polars DataFrames, especially for signal processing and feature extraction.
So far these utilities comprise those that I found to be missing or lacking from the List namespace within the Polars library while I was working on a project at work that required extensive handling of signal data which I was storing in Polars DataFrames.
By providing these utilities as a Polars plugin, and thus not having to leave the Polars DataFrame for these operations, I was able to significantly speed up the processing of my data by benefiting from Polars query optimization and parallelization. So while the operations themselves are not necessarily faster than their Numpy counterparts (although they might be in some cases), the integration with Polars gave my larger processing pipeline a significant speed boost.
-
polist.apply_interp- Interpolates a new List-type column from 3 specified List-type columns.
- Behaviour as expected from the
numpy.interpfunction, but for Polars DataFrames. - Supply the
x_column,y_column, andxp_columncolumns to obtain the interpolated y-values.
-
polist.apply_butterworth- Applies a Butterworth filter (low-pass, high-pass, band-pass) to a List-type column of signal data.
- The filter is applied bidirectionally (like
scipy.signal.filtfilt), so there is no phase lag, but the magnitude response is squared: the cutoff sits at -6dB instead of -3dB. - A band-pass doubles the design order, as in
scipy.signal.butter.
-
polist.apply_fft- Applies a (real) Fast Fourier Transform (FFT) to a List-type column of signal data,
producing the
N/2 + 1amplitudes from DC to Nyquist. - Can pre-process the signals with a windowing function (e.g. Hann, Blackman).
- Can scale the amplitudes following the scipy conventions:
amplitudereads a tone's peak amplitude,powerits mean-square (scipy.signal.periodogram(scaling="spectrum")), andpsdits power density (scaling="density", integrates to the signal's mean-square power). - The length of each signal must be a power of two, and the corresponding frequency axis
is given by
[i * sample_rate / N for i in range(N // 2 + 1)].
- Applies a (real) Fast Fourier Transform (FFT) to a List-type column of signal data,
producing the
-
polist.agg_slices- Computes an aggregation of a range of y-values defined by some x-values for List-type columns.
- This is useful for feature extraction from signals, e.g. to compute the mean of a signal in a certain time range or a spectrum in a certain frequency range.
- Ranges to include or exclude can be given as simple
(lo, hi)tuples or with explicit boundary modes like((lo, "closed"), (hi, "open")).
-
polist.agg_lists- Applies element-wise list-aggregations to a List-type column in a GroupBy context.
- This is implemented in pure Polars (no plugin), and lives here so that both aggregation functions offer the same aggregations with the same missing-data behaviour.
The four plugin functions accept a length-1 literal list column (e.g. pl.lit([...])) for
any input and broadcast it across rows. Invalid configuration (bad cutoffs, unknown window
names, mismatched list lengths) raises an error instead of silently returning nulls, while
per-row data problems (e.g. a signal length that is not a power of two) yield null rows.
Both aggregation functions support mean, median, std, min, max, delta, and
count, and both handle missing data exactly like the vertical aggregations of Polars
itself:
- Nulls are skipped: excluded from both the numerator and the denominator, so
countonly counts non-null values and an empty or all-null selection yields null (count: 0). - NaNs propagate: Polars treats NaN as a legitimate float value, so it flows into the
sum and poisons
meanandstd. Two exceptions to be aware of areminandmax, which skip NaNs (unless all values are NaN), andmediansorts NaN as the largest value. stdis the sample standard deviation (ddof=1) and yields null for fewer than two values, as in Polars.
The three transforms instead turn any row with missing data (a null row, an empty list, or a list containing nulls) into a null output row: a signal with missing samples cannot be meaningfully transformed.
import polars as pl
import polars_list_utils as polist

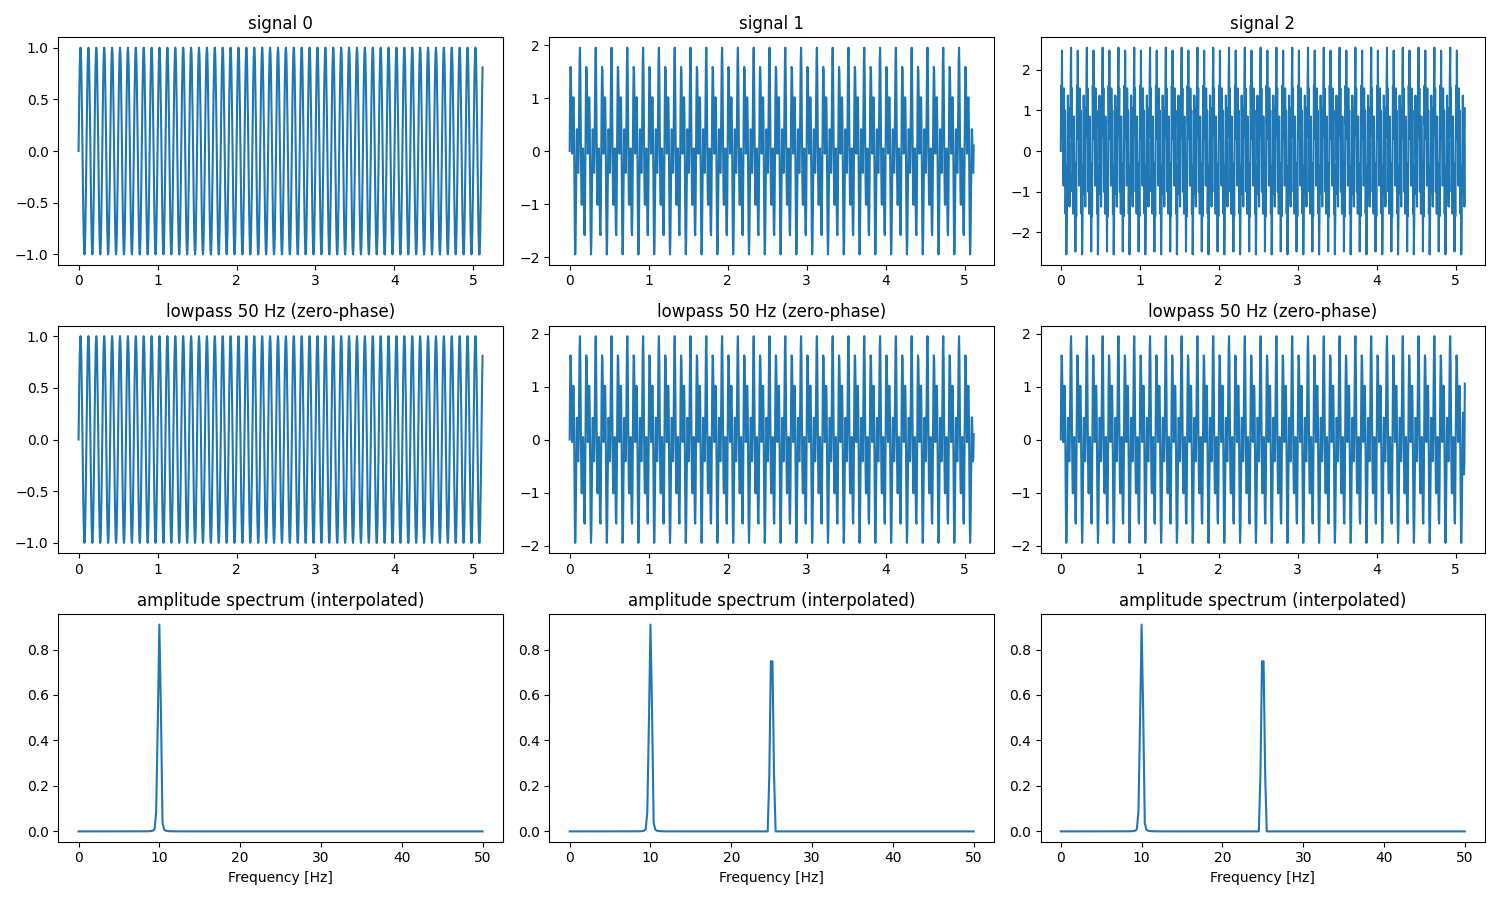
Fs, N = 200.0, 1024
FREQS = [i * Fs / N for i in range(N // 2 + 1)]

df = (
    df
    .with_columns(
        polist.apply_butterworth(
            "signal",
            sample_rate=Fs,
            max_freq=50.0,
        )
        .alias("filtered")
    )
    .with_columns(
        polist.apply_fft(
            "filtered",
            sample_rate=Fs,
            window="hann",
            scaling="amplitude",
        )
        .alias("fft")
    )
    .with_columns(
        polist.agg_slices(
            "fft",
            pl.lit(FREQS),
            aggregation="mean",
            slices_include=[(20.0, 30.0)],
        )
        .alias("mean_20_30hz")
    )
)
See examples/showcase.py for the full pipeline:
uv pip install polars-list-utils- Setup Rust (i.e. install rustup)
- Setup Python (i.e. install uv)
- Setup environment and compile plugin:
uv sync --extra dev
uv run maturin develop --release --uv- (Maybe) configure Cargo to find uv's Python installs. For example:
# .cargo/config.toml
[env]
PYO3_PYTHON = "C:\\Users\\travis.hammond\\AppData\\Roaming\\uv\\python\\cpython-3.12.0-windows-x86_64-none\\python.exe"
- Test and run the example:
uv run pytest
uv run ./examples/showcase.py- Lint:
uvx ty check
uvx ruff check
cargo clippy --release -- -D warnings
cargo fmt