
index.html + app.js + styles.css form a self-contained interactive
timeline + map application over the GeoJSON dataset:
- Timeline — a slider with one tick per available snapshot, era shortcut
buttons (Prehistory → Contemporary), play/pause animation, and ‹ › stepping
(arrow keys work too). The current year is shown in the header, sidebar and
timeline, and deep-linkable via
?year=1492. - Three map views, switchable from the header and via
?view=:- Atlas — flat D3 map (Natural Earth projection) with pan/zoom, tooltips, entity selection and an info panel.
- Map — a Leaflet slippy map. A graticule replaces modern web tiles so historical borders are never overlaid on present-day geography (this also keeps the app fully offline-capable).
- Globe — a 3D orthographic globe viewer (D3): drag to rotate, scroll to zoom, with slow auto-rotation when idle.
- Historical regions are colored by their controlling authority
(
SUBJECTO) and styled byBORDERPRECISION(approximate borders are dashed/translucent — see the Border confidence legend). Settlements fromplaces.geojsonrender in every view, filtered by the selected year.
Serve the folder with any static file server (e.g. python3 -m http.server)
and open index.html.
"For most of the past 5,000 years, kingdoms and empires were exceptional islands of political hierarchy, surrounded by much larger territories whose inhabitants systematically avoided fixed, overarching systems of authority." - Graeber and Wengrow, 2021, The Dawn of Everything
This historical boundaries project aims at providing ready-to-use base maps for mapping historical data. It is work in progress: verify the maps by comparison to other sources before using in academic work. If you see errors, report them in the "issues" section.
Structure we're setting up

This is deliberately more than a basic D3 map. The UI is now structured as:

┌──────────────────────────────────────────────────────────────┐
│  ◉ HISTORICAL ATLAS      1492 AD   [Atlas|Map|Globe]  ⌕  ?   │
├───────────────┬──────────────────────────────────────────────┤
│               │                                              │
│ FIND PLACE    │                                              │
│ ┌───────────┐ │                                              │
│ │ Search... │ │                  HISTORICAL                  │
│ └───────────┘ │                     MAP                      │
│               │                                              │
│ HISTORICAL    │                                              │
│ 1492 AD       │                         +                    │
│               │                         −                    │
│ ENTITIES      │                         ◌                    │
│               │                                              │
│ Spain         │                                              │
│ France        │                                              │
│ Ottoman       │                                              │
│ ...           │                                              │
│               │                                              │
│ BORDER        │                                              │
│ ─ Precise     │                                              │
│ - Approx.     │                                              │
├───────────────┴──────────────────────────────────────────────┤
│ CHRONOLOGY     Historical timeline       ‹  PLAY  ›          │
│                                                              │
│ ●──────●────────●──────●────────●────────●───────────────●  │
│ Earliest            1492                       Present        │
│                                                              │
│ Prehistory Ancient Classical Medieval Early Modern Modern   │
├──────────────────────────────────────────────────────────────┤
│ Historical Atlas / Historical boundaries      42 regions     │
└──────────────────────────────────────────────────────────────┘

The key thing is that the HTML doesn't need to change much as we expand the application. We can add later:

historical events
wars
battles
rulers
dynasties
religions
languages
population
economic data
military strength
migrations
trade routes
exploration routes
colonial possessions
treaties
revolutions
infrastructure
cities
archaeological sites
custom user datasets

all as additional timeline layers over the same geographic engine.
Several apps using the historical-basemaps dataset have been developped. A non-exhaustive list:
- Historic Borders: a web app with timeline, by Adam (GitHub user @ngrapple).
- Point in History: a web app to visualize the history of any point on the planet by Hans Hack.
- A web app on ourednik.info (aplha release) alows you to exlore the dataset in alternative map projections.
You'll find other use examples with D3 and Leaflet on ourednik.info.
All maps are stored in the geojson format: single file per feature layer, human and machine readable, easy to import in qGIS or use in D3 (see d3v5_example.html as well as d3v5_roughjs_example.html with the additional use of rough.js). Integration in Leaflet, OpenLayers et al. is also easy to achieve.
A lightweight summary of the dataset is available in index.json. It lists:
- The
yearand corresponding.geojsonfilename - The list of
countries(based onNAMEproperty) in each file
This file is auto-generated on every commit via GitHub Actions and helps applications quickly query available years or filter by country without loading full files.
Example:
{
  "year": 1492,
  "filename": "world_1492.geojson",
  "countries": ["Spain", "Portugal", "Inca Empire"]
}
You can regenerate it manually by running:
node scripts/generateIndex.jsGeocoding precision of multipolygons is adapted for mapping data on world/continent scale. The following fields are available in every file:
- NAME: the name of the country or region; ideal for text labels
- SUBJECTO: the name of the colonial power exercising authority on the country or region; the name of the region otherwise; ideal for choropleth colors
- PARTOF: when a region is part of a larger cultural area, e.g. Czechs as part of the Slavic tribes.
- BORDERPRECISION : ordinal values 1 (approximate), 2 (moderately precise) and 3 (determined by international law). Ideal for handling approximate border with blur intensity or other visual effect.
The file called places.geojson contains locations of cities and other settlements. For now, it is only a draft and needs your help for completion. Places throughout history can be added to this single file. When used in visualisation software or code, it can be filtered by time fields:
- name {string}: the toponym (it would be great to have this as nested JSON object, as suggested here, for places whose toponym changed over time, but this is not yet handled by standard GIS; for now, create distinct points with identical coordinate for each inhabitedSince to inhabitedUntil period)
- inhabitedSince {integer}: inhabited since year
- inhabitedUntil {integer}: inhabited until year, or NULL if it still is.

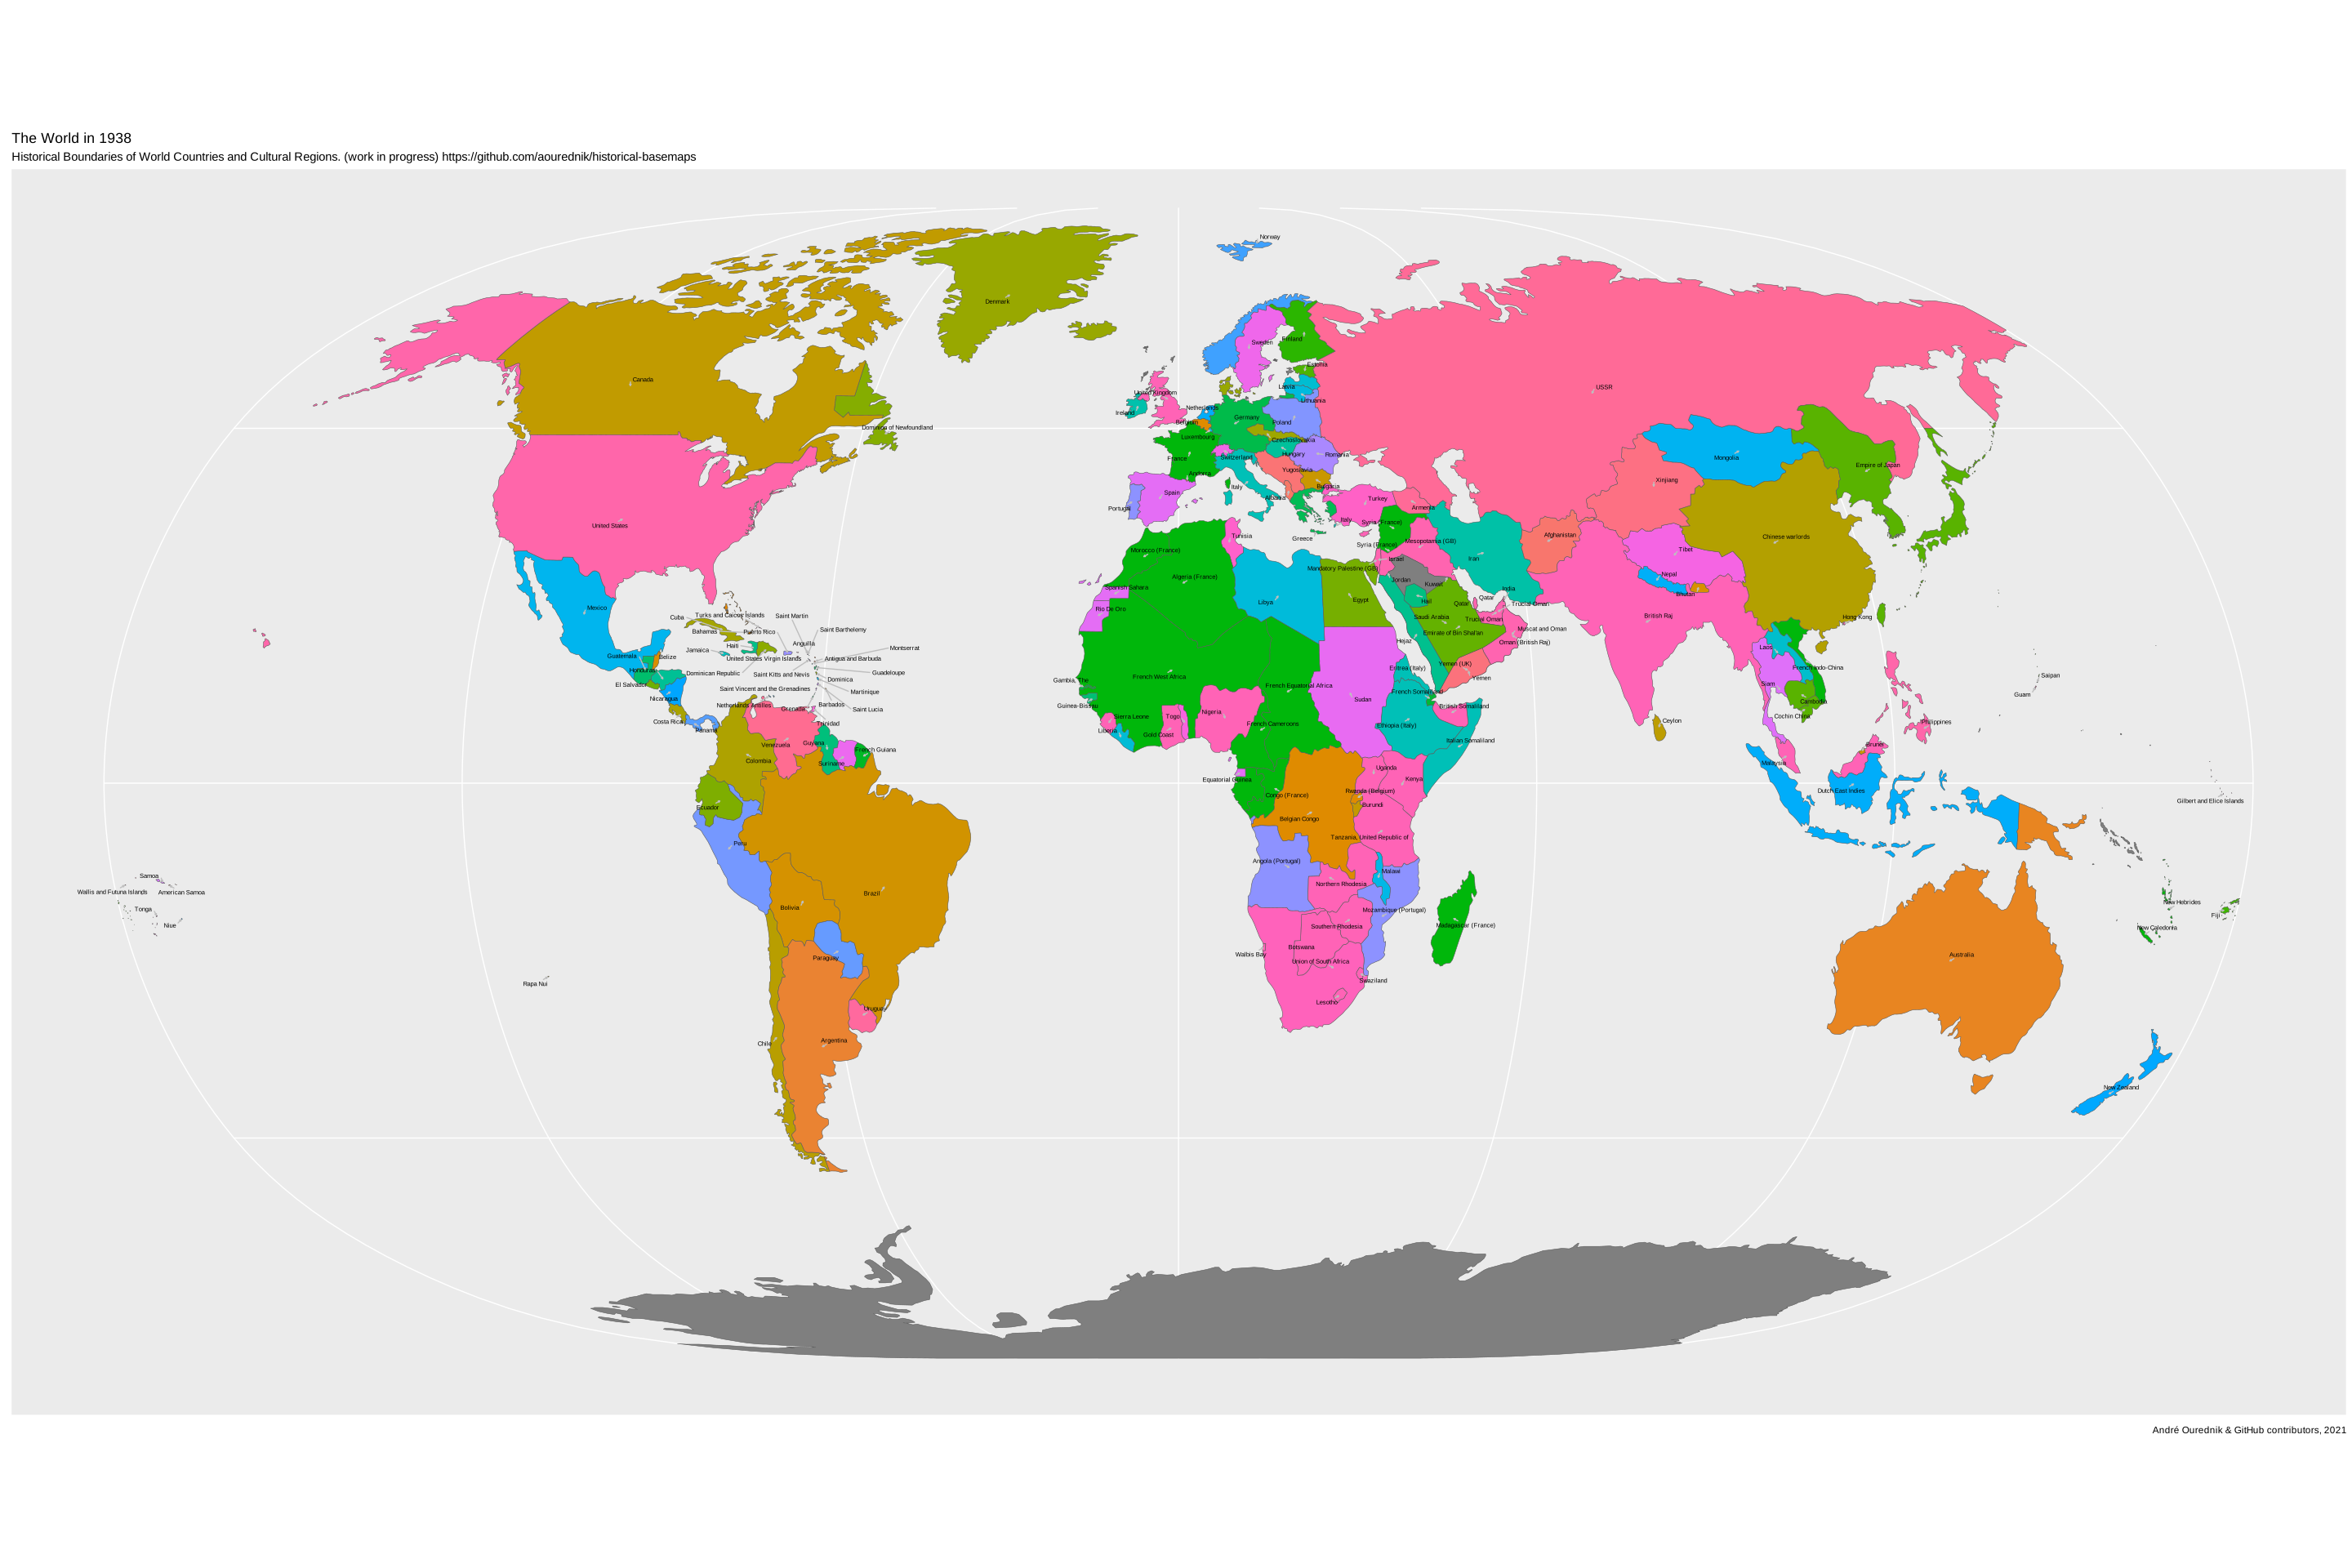
The maps in the Scalable Vector Graphics format are the result of a conversion of GeoJSON files with the R script geojson2svg.Rmd. By default, the script uses a "Natural Earth" projection, which can be changed by using another PROJ string than natearth2 in st_transform(geodata, "+proj=natearth2").
Please see these SVG files only as raw material editable with a vector drawing software for the needs of GIS-unsavvy users. If you contribute to this Git repository, please edit directly - and only - the GeoJSON files.
When using the data, keep in mind that
- historical boundaries are even more disputed than contemporary ones, that
- the actual concept of territory and national boundary becomes meaningful, in Europe, only since the Peace of Westphalia (1648), that
- areas of civilizations actually overlap, especially in ancient history, and that
- overlaying these ancient vector maps on contemporary physical maps can be misleading; rivers, lakes, shorelines do change very much over millennia; think for instance about the evolution of the Aral Sea since the 1980s.
Overlapping areas are usually dealt with as topological errors in traditional GIS, but some overlaps make sense in the case of this repository. Notwithstanding epistemological and historiographical concerns, the pragmatic bottom line is: vector GIS has points, polygons and lines. That's it. Nevertheless, when redendering, transparent layers (opacity < 100%) and blur effects is a convenient way to deal with fuzzy and overlapping borders of pre-modern societies.

Visual distinction between precise and approximate borders can also be achieved on the same map. See this D3js example.

The geodata are stored in the WGS 84 projection, EPSG:4326 (crs:OGC:1.3:CRS84). Coordinates are in LatLon, the projection is geographical. Consider reprojecting to show the maps on world scale, choosing a projection with minimal area distortion, such as the Dymaxion (AirOcean) projection or the Molweide projection.

Most mapping software and algorithms reproject on the fly. Globe wrapping is also possible, as illustrates ngrapples's app:

You are welcome to contribute by making your forks and filing git pull requests. Further notes on contributing in CONTRIBUTING.md.
This project started as a collection of basemaps collected, adapted and converted from diverse sources, sometimes only available through the wayback machine. Among these sources, anonymous students from the "ThinkQuest Team C006628".
- CShapes by Niels Weidman, also available as an R package.
- GIS data : historical country boundaries
- Old Maps Online.
- Native Land. Contains notably maps of territorial conventions between colonizers and native populations in the Americas and Australia. User contributions possible via a GIS interface. These maps are also available in GeoJSON format.
- David Rumsey Map Collection: The most important historical maps repositoriy. Over 60000 ancient maps, some reprojected on interactive globes.
- Ancient World Mapping Center at the University of North Carolina
- Atlas of Human Evolution. A nice tool for the prehistory of the Homo species. Takes into account also the evolution of sea levels.
- Euratlas.net. Mostly reliable but very old technology.
- Geacron.com. "Interactive World History Atlas since 3000 BC". A nice tool, but offering no possibility to extract polygons for use in a GIS. A commercial version of the program allows you to see a timeline.
- Wikimedia: Maps of the world showing history
-
Ourednik, A. (2022) "The impossible territory and the maps of the boyar Kraiensky", in Maps and Spaces (translation of "L’impossible territoire et les cartes du boyard Kraïenski" in GeoAgenda No. 4/2021.). (research essay) - Unstable borders are a cartographer’s nightmare. The simple task of reporting on demographic changes quickly becomes a headache in a country whose municipalities merge, divide, and even change their spatial contours according to the projects of their inhabitants and councilors, who feel no pressing need of being aggregated on a national scale.
-
Ourednik, A. (2019) Hypertopie: de l'utopie à l'omniscience, La Baconnière. (essay, in French) - on the notion of hypertopia, comprising the "impossible here" of identitarian utopias and the collapse of contemporary space into an infinite hit et nunc.
-
Ourednik, A. (2014), The impossible here (research paper) - "Grain upon grain, one by one, and one day, suddenly, there’s a heap, a little heap, the impossible heap."
-
Ourednik, A. (2015) Les cartes du boyard Kraïenski (novel, in French) - a cartographer sent to map the eastern border or the European Union gets lost in a fictive country somewhere between Ukraine and Bulgaria...
-
Ourednik, A. (2010) L'habitant et la cohabitation dans les modèles de l'espace habité (2010), EPFL. (PhD thesis, in French) - on the notion of codwelling in space and time. Central topic: changing spatial ontologies (i.e. the type and extent of things in space).