Real-time epidemiological surveillance dashboard for dengue and chikungunya in Brazil. Built with Next.js and Mosqlimate API.
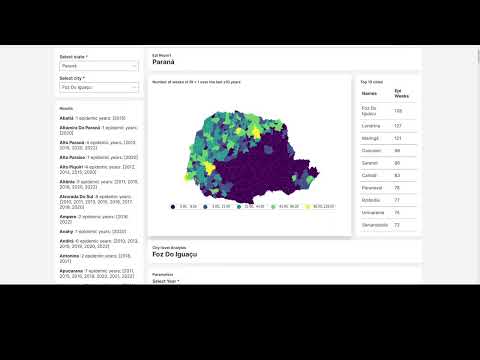
- Framework: Next.js 16 (App Router, Turbopack)
- Maps: Leaflet + react-leaflet
- UI: Tailwind CSS + shadcn/ui
- Charts: Recharts
- Data: Mosqlimate REST API
- Container: Docker Compose
- Node.js 22+
- Docker and Docker Compose
# Install dependencies
npm install

# Start dev server
npm run dev
The app will be available at http://localhost:3000.
# Build and start with Docker
docker compose up -d --buildState boundary files are served from public/states/{UF}.json. These are
Brazilian municipality polygons from geobr.
To regenerate them:
python scripts/download_geojson.py| Route | Description |
|---|---|
/api/cities |
Municipalities for a state |
/api/top-cities |
Top municipalities by transmission weeks |
/api/maps/weeks |
Transmission week counts per municipality |
/api/maps/r0 |
R₀ values per municipality |
/api/maps/model-eval |
Model evaluation rates |
/api/timeseries |
Weekly case counts for a city |
/api/parameters |
SIR model parameters |
/api/geolocation |
Auto-detect user's state by IP |
Data is served by the Mosqlimate API. See the episcanner-downloader repository for data pipeline details.